Proved Natural Gas Reserves
| Countries Continents |
at end 1991 | at end 2001 | at end 2010 | Trillion cubic feet |
| Trillion cubic metres |
Trillion cubic metres |
Trillion cubic metres |
||
| US | 4,74 | 5,2 | 8,2 | 299,83 |
| Canada | 2,72 | 1,7 | 1,79 | 70,02 |
| Mexico | 2,01 | 0,8 | 0,34 | 12,5 |
| Total North America | 9,47 | 7,70 | 10,33 | 382,35 |
| Argentina | 0,65 | 0,77 | 0,36 | 12,03 |
| Bolivia | 0,12 | 0,78 | 0,29 | 9,93 |
| Brazil | 0,13 | 0,22 | 0,42 | 15,99 |
| Colombia | 0,1 | 0,13 | 0,16 | 5,76 |
| Peru | 0,35 | 0,25 | 0,36 | 12,47 |
| Trinidad and Tobago | 0,24 | 0,58 | 0,39 | 14,17 |
| Venezuela | 3,59 | 4,18 | 5,46 | 195,19 |
| Other S. and Cent. America | 0,17 | 0,13 | 0,07 | 2,24 |
| Total S. and Cent. America | 5,31 | 7,01 | 7,47 | 267,74 |
| Azerbaijan | n/a | 1,24 | 1,28 | 44,87 |
| Denmark | 0,11 | 0,15 | 0,06 | 1,63 |
| Germany | 0,17 | 0,2 | 0,07 | 2,2 |
| Italy | 0,34 | 0,17 | 0,1 | 3,08 |
| Kazakhstan | n/a | 1,78 | 1,89 | 66,44 |
| Netherlands | 1,77 | 1,47 | 1,11 | 38,89 |
| Norway | 1,28 | 2,19 | 2,05 | 73,11 |
| Poland | 0,16 | 0,12 | 0,13 | 4,28 |
| Romania | 0,49 | 0,33 | 0,6 | 3,85 |
| Russian Federation | n/a | 42,36 | 44,38 | 1574,98 |
| Turkmenistan | n/a | 2,59 | 13,38 | 858,81 |
| Ukraine | n/a | 1,01 | 0,94 | 33,02 |
| United Kingdom | 0,55 | 1,11 | 0,21 | 7,14 |
| Uzbekistan | n/a | 1,68 | 1,61 | 56,59 |
| Other Europe and Eurasia | 50,11 | 0,46 | 0,29 | 10,02 |
| Total Europe and Eurasia | 54,92 | 56,78 | 68 | 2778,84 |
| Bahrain | 0,18 | 0,11 | 0,22 | 12,28 |
| Iran | 19,8 | 26,11 | 33,1 | 1168,57 |
| Iraq | 3,1 | 3,11 | 3,18 | 126,71 |
| Kuwait | 1,52 | 1,56 | 1,79 | 63,01 |
| Oman | 0,1 | 0,95 | 0,95 | 33,55 |
| Qatar | 6,43 | 25,79 | 25,05 | 884,53 |
| Saudi Arabia | 5,23 | 6,46 | 8,02 | 287,83 |
| Syria | 0,21 | 0,25 | 0,29 | 10,07 |
| United Arab Emirates | 5,8 | 6,06 | 6,09 | 215,07 |
| Yemen | 0,4 | 0,48 | 0,49 | 16,92 |
| Other Middle East | (2) | 0,06 | 0,23 | 7,81 |
| Total Middle East | 42,73 | 70,9 | 79,37 | 2826,29 |
| Algeria | 3,63 | 4,53 | 4,51 | 159,06 |
| Egypt | 0,4 | 1,56 | 2,22 | 77,34 |
| Libya | 1,31 | 1,32 | 1,5 | 52,8 |
| Nigeria | 3,41 | 4,64 | 5,12 | 180,46 |
| Other Africa | 0,79 | 1,11 | 1,21 | 43,54 |
| Total Africa | 9,52 | 13,14 | 14,53 | 513,19 |
| Australia | 0,95 | 2,67 | 3,67 | 132,76 |
| Bangladesh | 0,73 | 0,35 | 0,36 | 12,51 |
| Brunei | 0,4 | 0,36 | 0,31 | 10,18 |
| China | 1,01 | 1,37 | 2,86 | 107,75 |
| India | 0,74 | 0,77 | 1,15 | 43,83 |
| Indonesia | 1,85 | 2,61 | 2,97 | 104,71 |
| Malaysia | 1,68 | 2,49 | 2,44 | 86,01 |
| Myanmar | 0,28 | 0,35 | 0,23 | 7,81 |
| Pakistan | 0,76 | 0,75 | 0,82 | 27,51 |
| Papua New Guinea | 0,41 | 0,43 | 0,45 | 15,61 |
| Thailand | 0,25 | 0,38 | 0,3 | 9,95 |
| Vietnam | (2) | 0,2 | 0,62 | 21,8 |
| Other Asia Pacific | 0,32 | 0,39 | 0,36 | 12,13 |
| Total Asia Pacific | 9,33 | 13,06 | 16,47 | 592,49 |
| Total World | 131,24 | 168,55 | 196,14 | 7360,86 |
| of which.. OECD | 15,18 | 16,09 | 18,09 | 660,2 |
| Non-OECD | 116,06 | 152,46 | 178,05 | 6700,66 |
| European Union | 3,76 | 3,63 | 2,33 | 64,41 |
| Former Soviet Union | 49,78 | 50,88 | 63,55 | 2638,54 |
| Countries Continents |
at end 2011 | Share of total |
R/P ratio |
| Trillion cubic metres |
|||
| US | 8,49 | 4,1% | 13,04 |
| Canada | 1,99 | 1,0% | 12,36 |
| Mexico | 0,36 | 0,2% | 6,75 |
| Total North America | 10,84 | 5,3% | 12,53 |
| Argentina | 0,35 | 0,2% | 8,78 |
| Bolivia | 0,29 | 0,1% | 18,3 |
| Brazil | 0,46 | 0,2% | 27,1 |
| Colombia | 0,17 | 0,1% | 14,88 |
| Peru | 0,36 | 0,2% | 31,07 |
| Trinidad and Tobago | 0,41 | 0,2% | 9,87 |
| Venezuela | 5,53 | 2,7% | (1) |
| Other S. and Cent. America | 0,07 | (3) | 23,71 |
| Total S. and Cent. America | 7,59 | 3,6% | 45,22 |
| Azerbaijan | 1,28 | 0,6% | 85,79 |
| Denmark | (2) | (3) | 6,52 |
| Germany | 0,07 | (3) | 6,22 |
| Italy | 0,09 | (3) | 11,37 |
| Kazakhstan | 1,89 | 0,9% | 97,63 |
| Netherlands | 1,11 | 0,5% | 17,16 |
| Norway | 2,07 | 1,0% | 20,41 |
| Poland | 0,13 | 0,1% | 28,29 |
| Romania | 0,11 | 0,1% | 9,91 |
| Russian Federation | 44,6 | 21,4% | 73,48 |
| Turkmenistan | 24,32 | 11,7% | (1) |
| Ukraine | 0,94 | 0,4% | 51,29 |
| United Kingdom | 0,21 | 0,1% | 4,47 |
| Uzbekistan | 1,61 | 0,8% | 28,11 |
| Other Europe and Eurasia | 0,29 | 0,1% | 29,4 |
| Total Europe and Eurasia | 78,69 | 37,8% | 75,93 |
| Bahrain | 0,35 | 0,2% | 26,8 |
| Iran | 33,1 | 15,9% | (1) |
| Iraq | 3,59 | 1,7% | (1) |
| Kuwait | 1,79 | 0,9% | (1) |
| Oman | 0,95 | 0,5% | 35,83 |
| Qatar | 25,05 | 12,0% | (1) |
| Saudi Arabia | 8,16 | 3,9% | 82,14 |
| Syria | 0,29 | 0,1% | 34,26 |
| United Arab Emirates | 6,09 | 2,9% | (1) |
| Yemen | 0,48 | 0,2% | 50,75 |
| Other Middle East | 0,23 | 0,1% | 49,32 |
| Total Middle East | 80,04 | 38,4% | (1) |
| Algeria | 4,51 | 2,2% | 57,75 |
| Egypt | 2,2 | 1,1% | 35,75 |
| Libya | 1,5 | 0,7% | (1) |
| Nigeria | 5,12 | 2,5% | (1) |
| Other Africa | 1,24 | 0,6% | 63,41 |
| Total Africa | 14,54 | 7,0% | 71,71 |
| Australia | 3,76 | 1,8% | 83,61 |
| Bangladesh | 0,36 | 0,2% | 17,81 |
| Brunei | 0,29 | 0,1% | 22,51 |
| China | 3,06 | 1,5% | 29,76 |
| India | 1,25 | 0,6% | 26,9 |
| Indonesia | 2,97 | 1,4% | 39,23 |
| Malaysia | 2,44 | 1,2% | 39,42 |
| Myanmar | 0,23 | 0,1% | 17,82 |
| Pakistan | 0,78 | 0,4% | 19,89 |
| Papua New Guinea | 0,45 | 0,2% | (1) |
| Thailand | 0,29 | 0,1% | 7,61 |
| Vietnam | 0,62 | 0,3% | 72,3 |
| Other Asia Pacific | 0,35 | 0,2% | 18,92 |
| Total Asia Pacific | 16,78 | 8,0% | 35,02 |
| Total World | 208,44 | 100,0% | 63,63 |
| of which.. OECD | 18,7 | 9,0% | 16,01 |
| Non-OECD | 189,75 | 91,0% | 90,01 |
| European Union | 1,83 | 0,9% | 11,77 |
| Former Soviet Union | 74,72 | 35,8% | 96,27 |
Notes..
(1) More than 100 years
(2) Less than 0.05
(3) Less than 0.05%
Proved reserves of oil - Generally taken to be those quantities that geological and engineering information indicates with reasonable certainty can be recovered in the future from known reservoirs under existing economic and operating conditions.
Reserves-to-production (R/P) ratio - If the reserves remaining at the end of any year are divided by the production in that year, the result is the length of time that those remaining reserves would last if production were to continue at that rate.
Reference(s) of data - The estimates in this table have been compiled using a combination of primary official source and third-party data from Cedigaz and the OPEC Secretariat.
Graphics of global Natural Gas Reserves-to-production (R/P) ratios
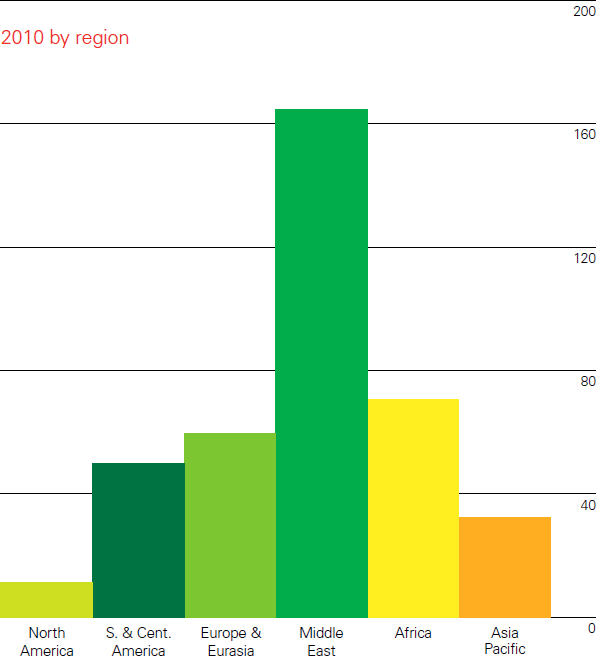
World natural gas proved reserves in 2010 were sufficient to meet 58.6 years of global production. R/P ratios declined for each region, driven by rising production. The Middle East once again had the highest regional R/P ratio, while Middle East and Former Siviet Union regions jointly hold 72% of the world's gas reserves.
Reference(s) ..

Related Post(s)
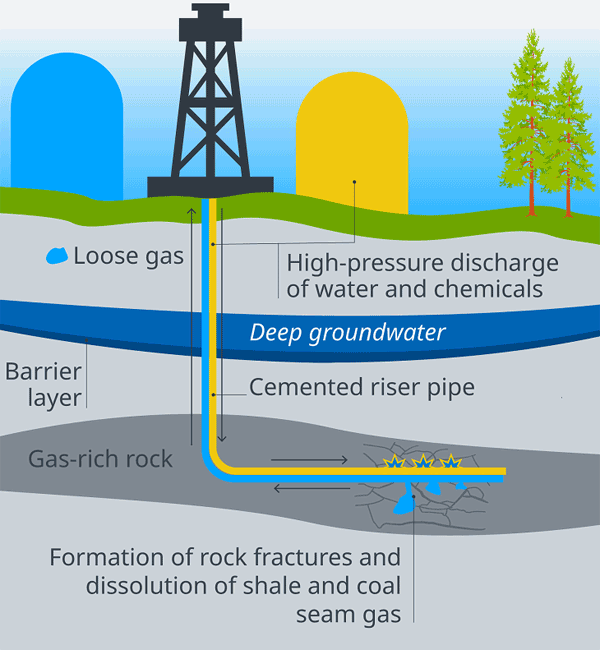
Fracking is a technique for increasing the permeability of rock so that oil, natural gas or geothermal energy can be extracted more easily...